Week 1: Introduction to Data Science and RStudio IDE
EVR 628- Intro to Environmental Data Science
Course Materials and Content
Course website at: jcvdav.github.io/EVR_628
Things you will be able to build
You will learn how to access, work with, and visualize many different types of environmental data. For example:
- Access public data repositories and build animated visualizations
- Track fishing vessels form space and build maps of fishing activity
- Develop interactive web-based apps to allow others explore your data
- Create slides with interactive content for effective communication
How will we approach data science?
How we think about projects
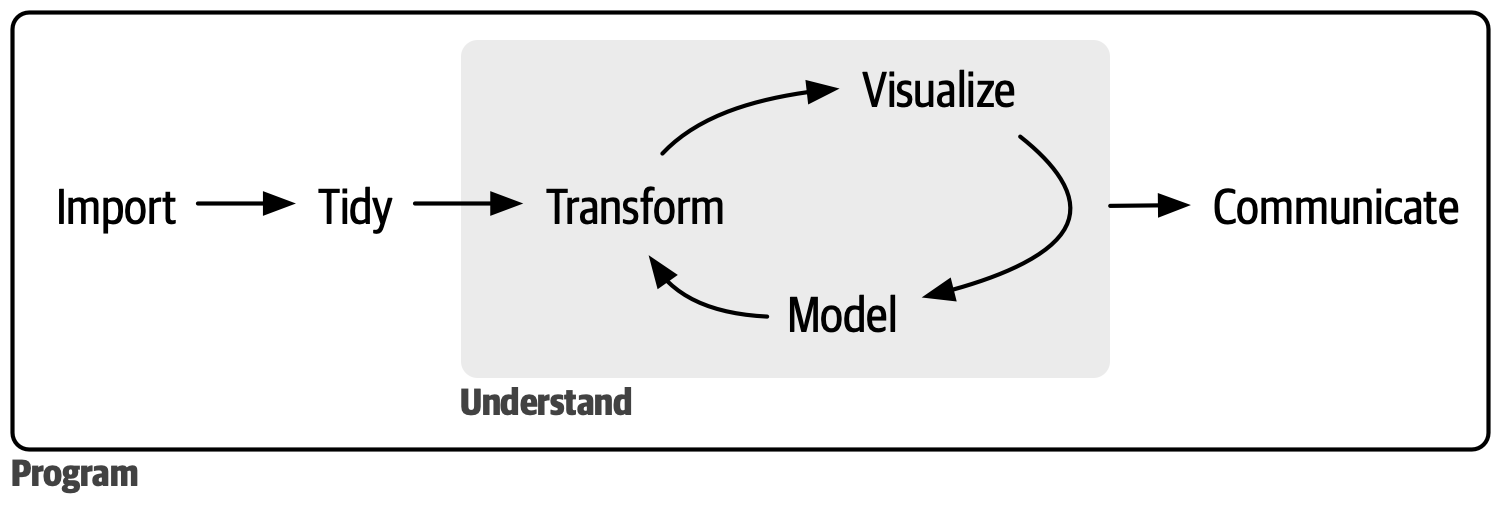
- Maybe also add “collect” before “import”
How we’ll learn things
- Organization (Weeks 1, 3, 4, 6)
- Visualization (Weeks 2, 5, 11)
- Reproducibility (Weeks 3, and throughout)
- Data management, transformation, wrangling (Weeks 6-9, 11)
- Spatial data, programming, and other extensions (Week 10 - 14)
- No modelling!
- No communication(-ish)
Side note #1: Other courses
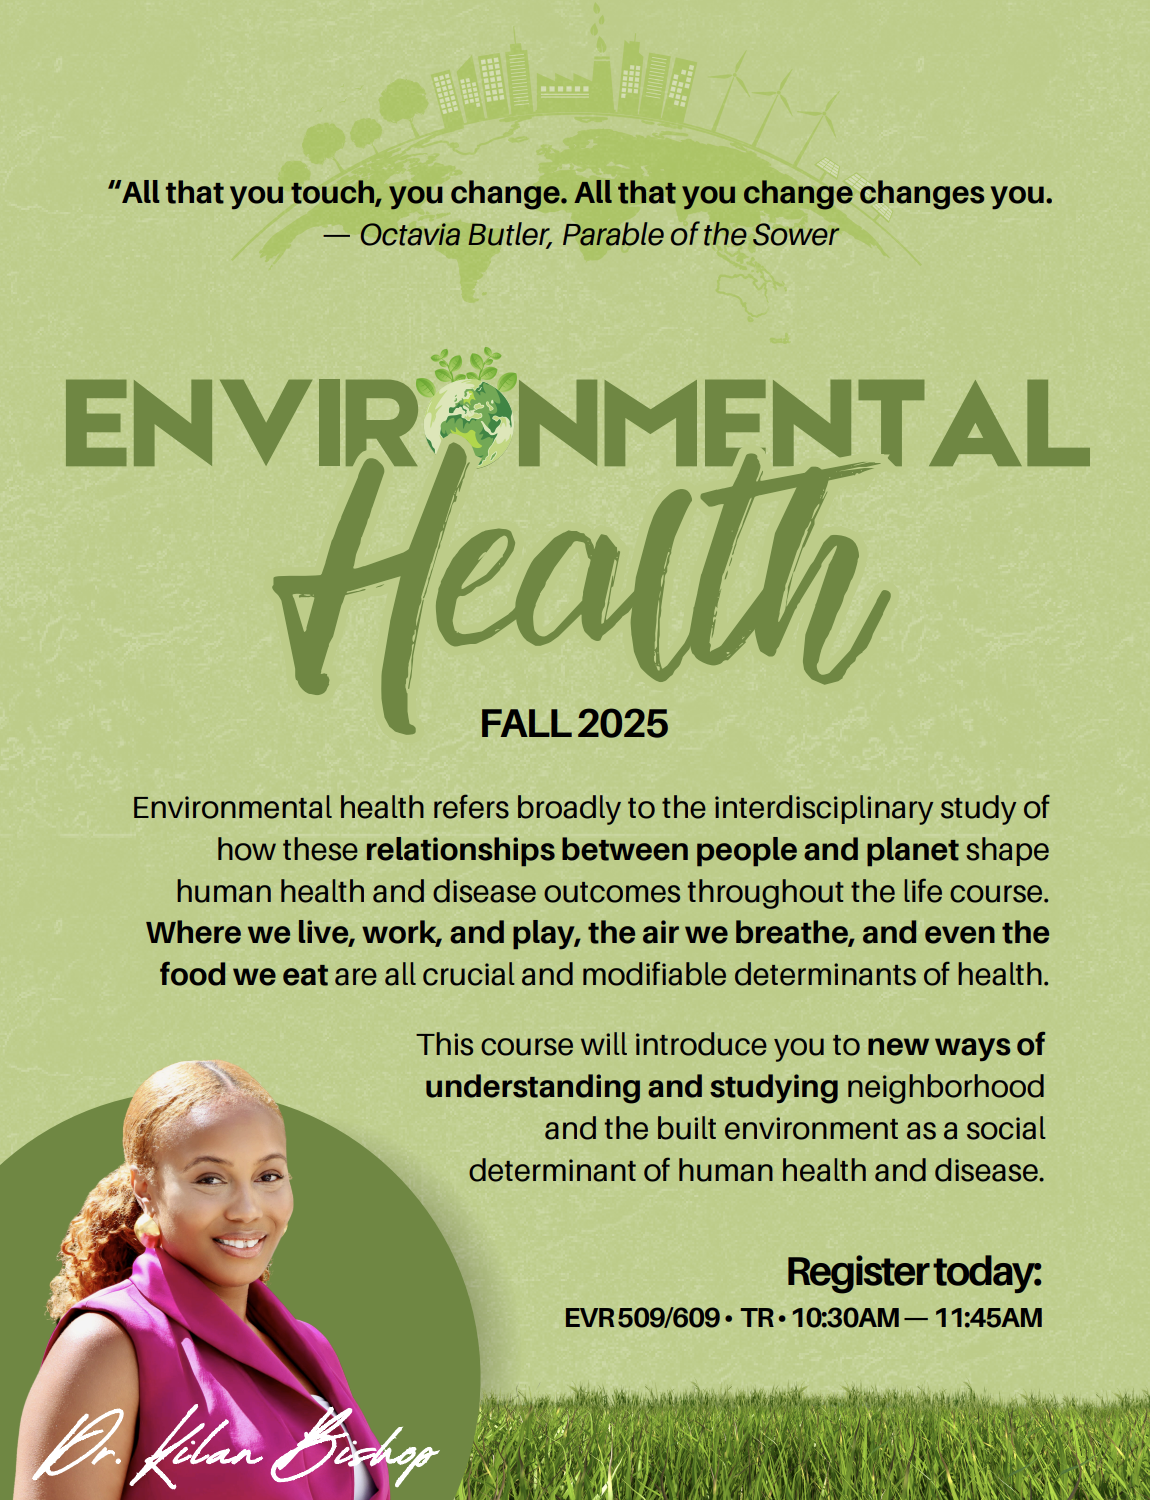
EVR 509/609
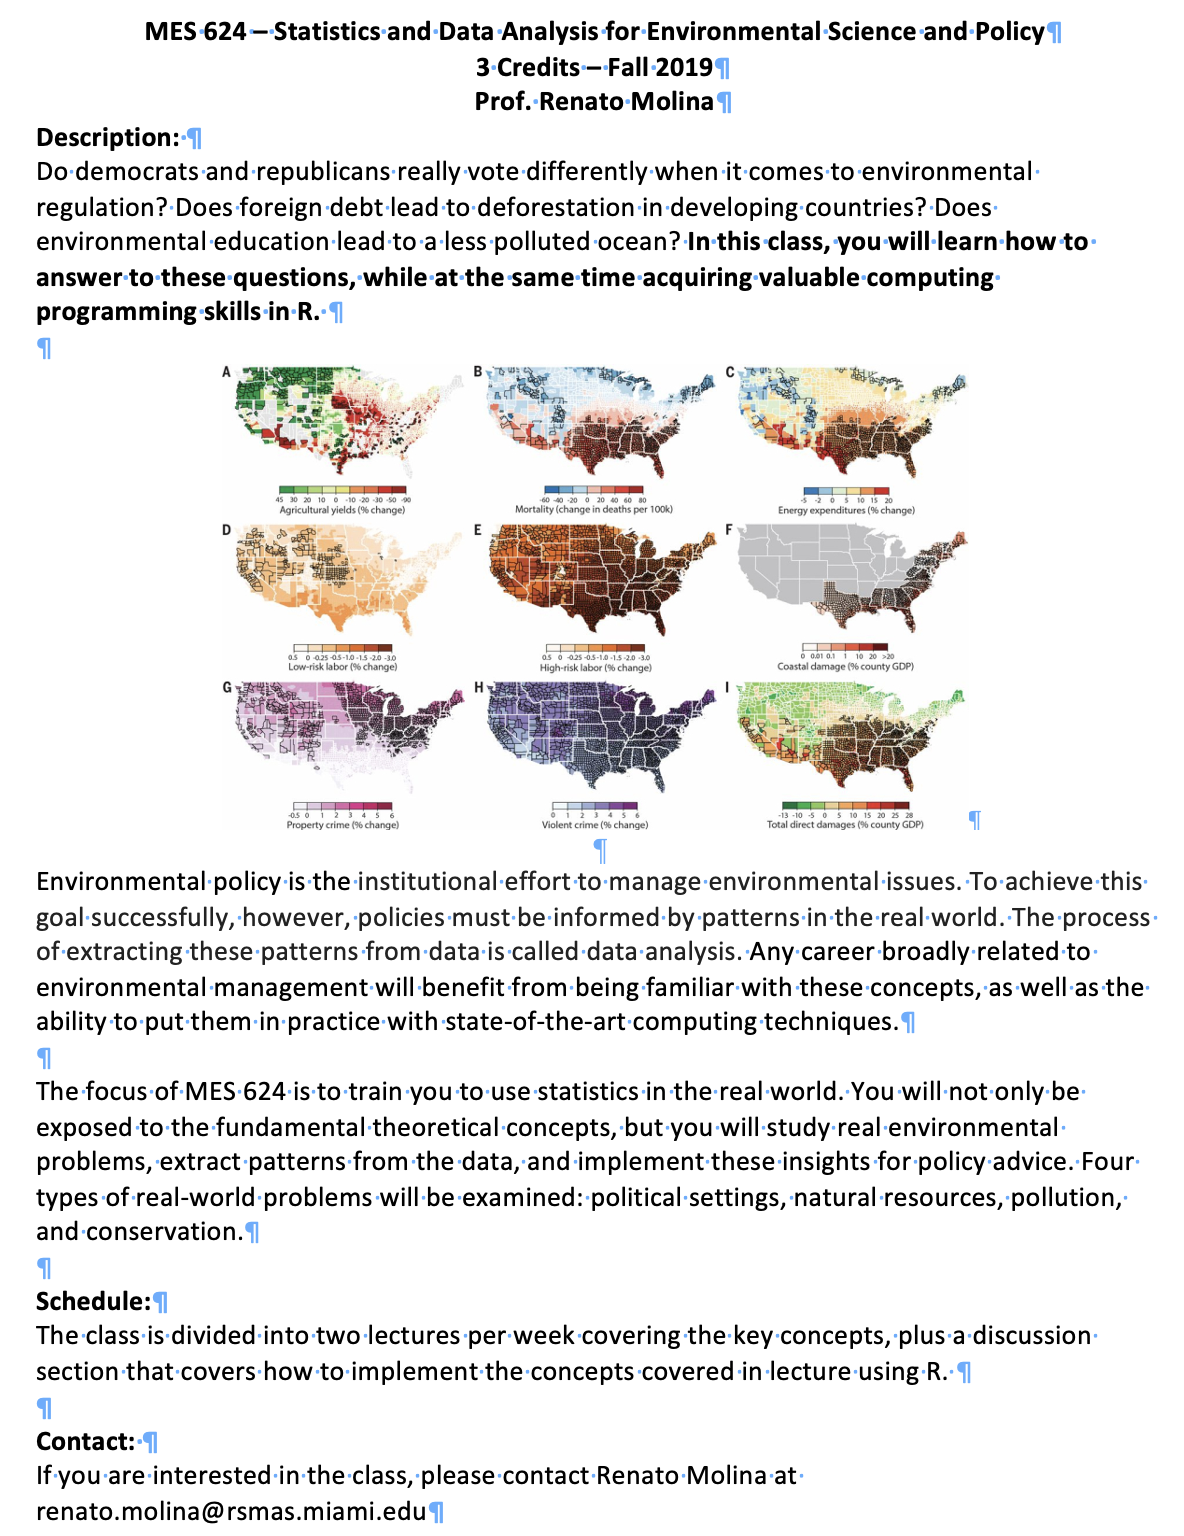
EVR 624
RSM612 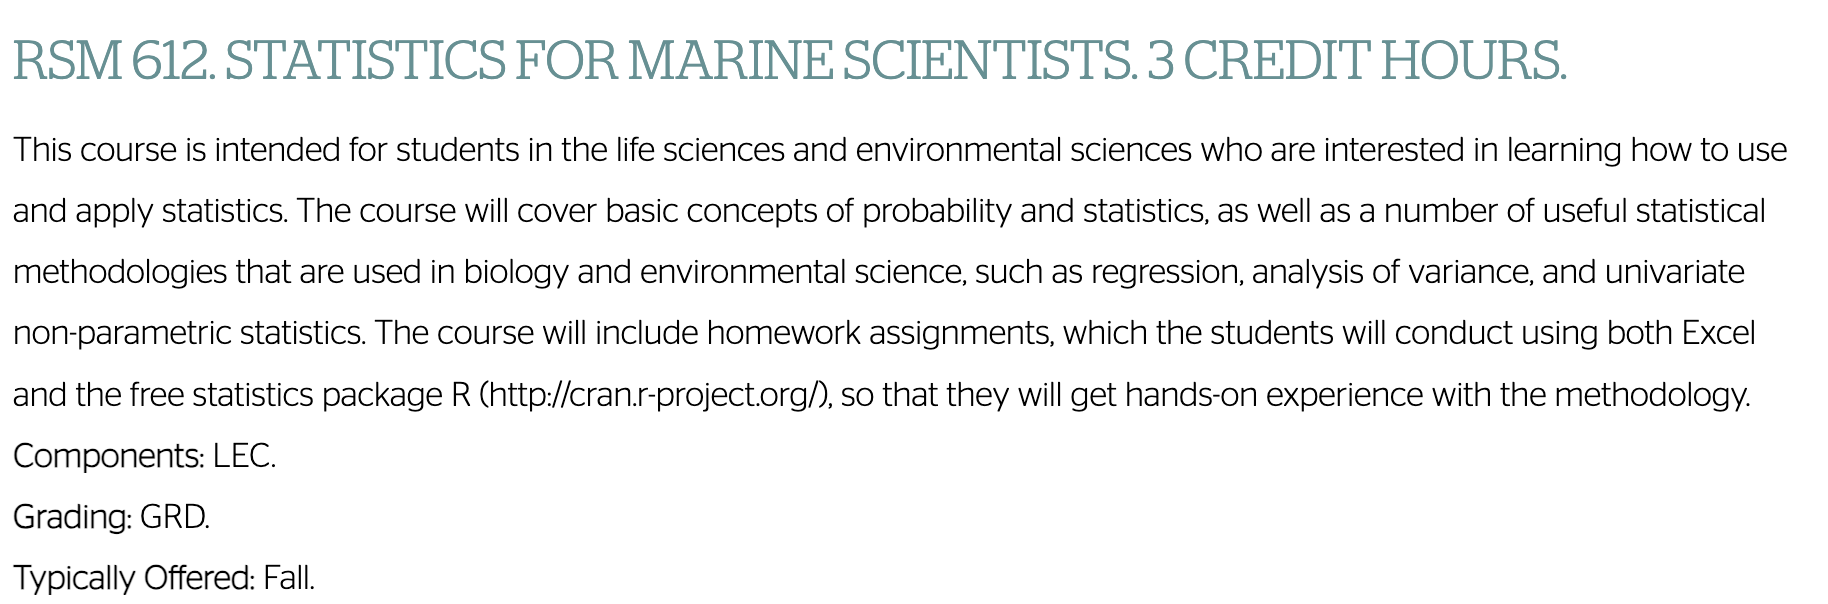
What is Data Science?
Code
library(tidyverse)
library(ggrepel)

tibble(skill = c("Coding", "Stats", "Domain"),
       x = c(-1, 1, 0),
       y = c(1, 1, -1)) |>
  ggplot(aes(x = x, y = y, label = skill, color = skill)) +
  geom_point(size = 100, alpha = 0.5) +
  geom_text(mapping = aes(label = skill),
            color = "black",
            nudge_x = c(-2, 2, 0),
            nudge_y = c(0.5, 0.5, -2)) +
  geom_text(x = 0, y = 0, label = "Data Science",
            color = "black") +
  coord_equal() +
  lims(x = c(-4, 4),
       y = c(-4, 4)) +
  theme_void() +
  theme(legend.position = "none")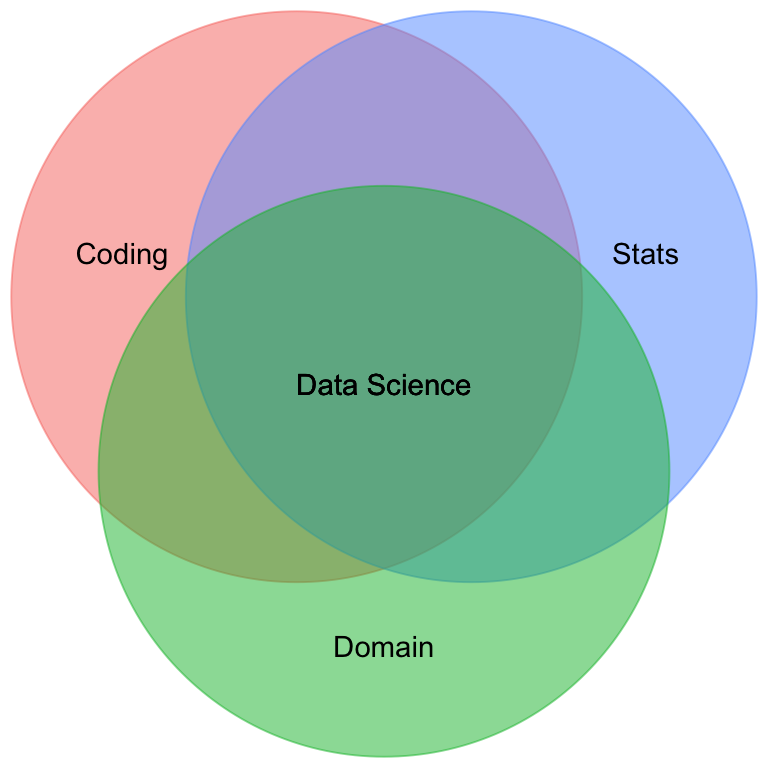
This course only covers one bubble: Talking to your computer