Propagates the treatment id from treatment_ids across control periods
Arguments
- time
A column name containing the time variable in the panel (i.e. the t dimension)
- id
A column name containing the unique identifier of the observational unit in the panel (the i dimension)
- treatment_id
A character specifying the treatment id, as produced by
treatment_ids()- window
A number indicating the number of periods within which two or more treatment events are merged. This should be in the same units as
time
Value
A character vector specifiying the treatment id for treated and control periods of a given unit
Examples
# Load packages
library(tidyr)
library(dplyr)
library(EventHorizon)
# Load a panel
panel <- simulate_panel(n_units = 10, n_periods = 10)
head(panel)
#> # A tibble: 6 × 3
#> id time treatment
#> <chr> <date> <int>
#> 1 A1 2025-01-01 0
#> 2 A1 2025-01-02 0
#> 3 A1 2025-01-03 0
#> 4 A1 2025-01-04 1
#> 5 A1 2025-01-05 0
#> 6 A1 2025-01-06 0
event_horizon_panel <- panel |>
mutate(treatment_id = treatment_ids(id = id,
time = time,
treatment = treatment,
window = 3),
relative_time = calculate_relative_time(id = id,
time = time,
treatment_id = treatment_id,
window = 3),
treatment_id = propagate_treatment_id(id = id,
time = time,
treatment_id = treatment_id,
window = 3)) |>
drop_na(treatment_id)
head(event_horizon_panel)
#> # A tibble: 6 × 5
#> id time treatment treatment_id relative_time
#> <chr> <date> <int> <chr> <dbl>
#> 1 A1 2025-01-01 0 treatment_A1_1 -3
#> 2 A1 2025-01-02 0 treatment_A1_1 -2
#> 3 A1 2025-01-03 0 treatment_A1_1 -1
#> 4 A1 2025-01-04 1 treatment_A1_1 0
#> 5 A1 2025-01-05 0 treatment_A1_1 0
#> 6 A1 2025-01-06 0 treatment_A1_1 0
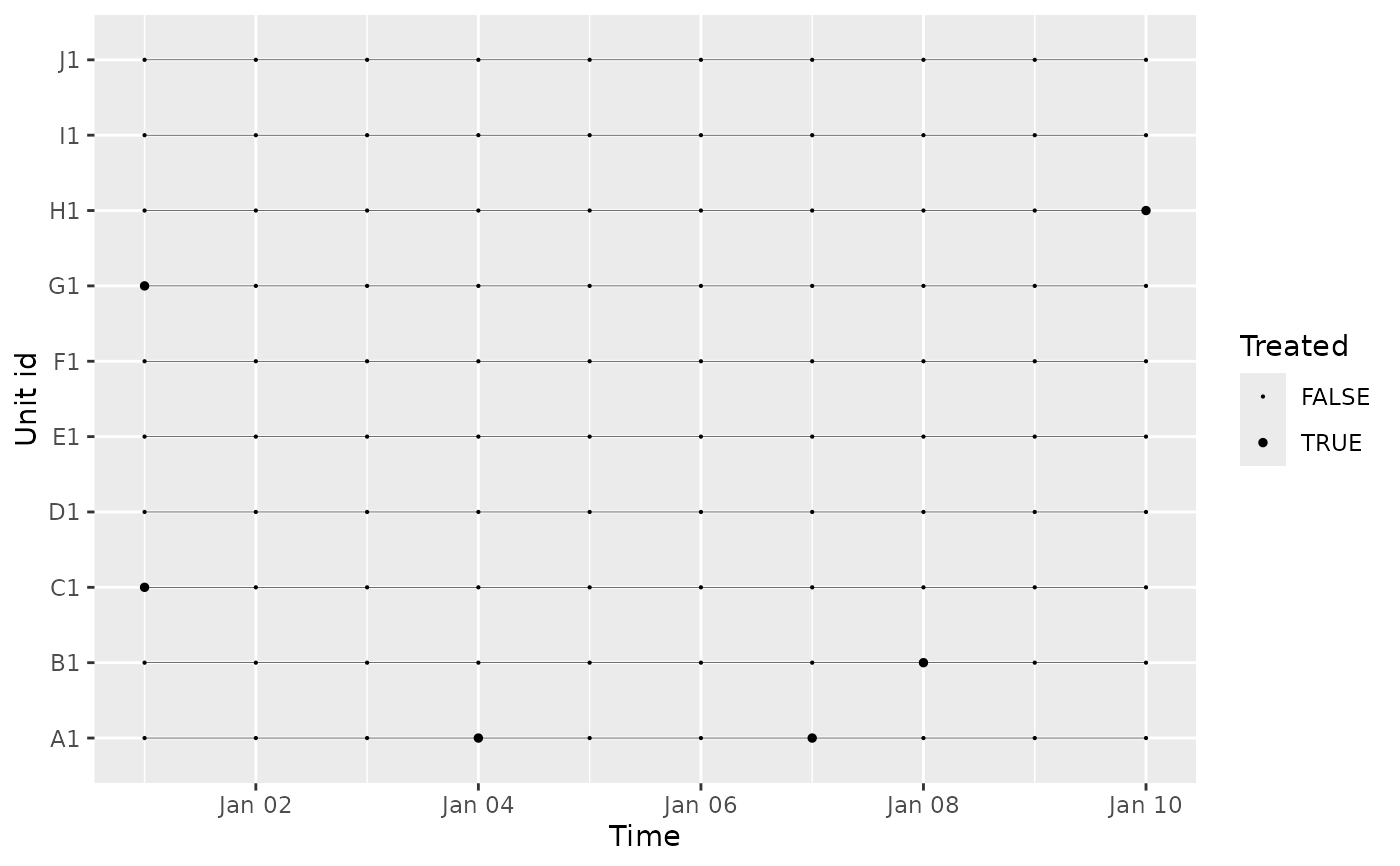
visualize_panel(panel)
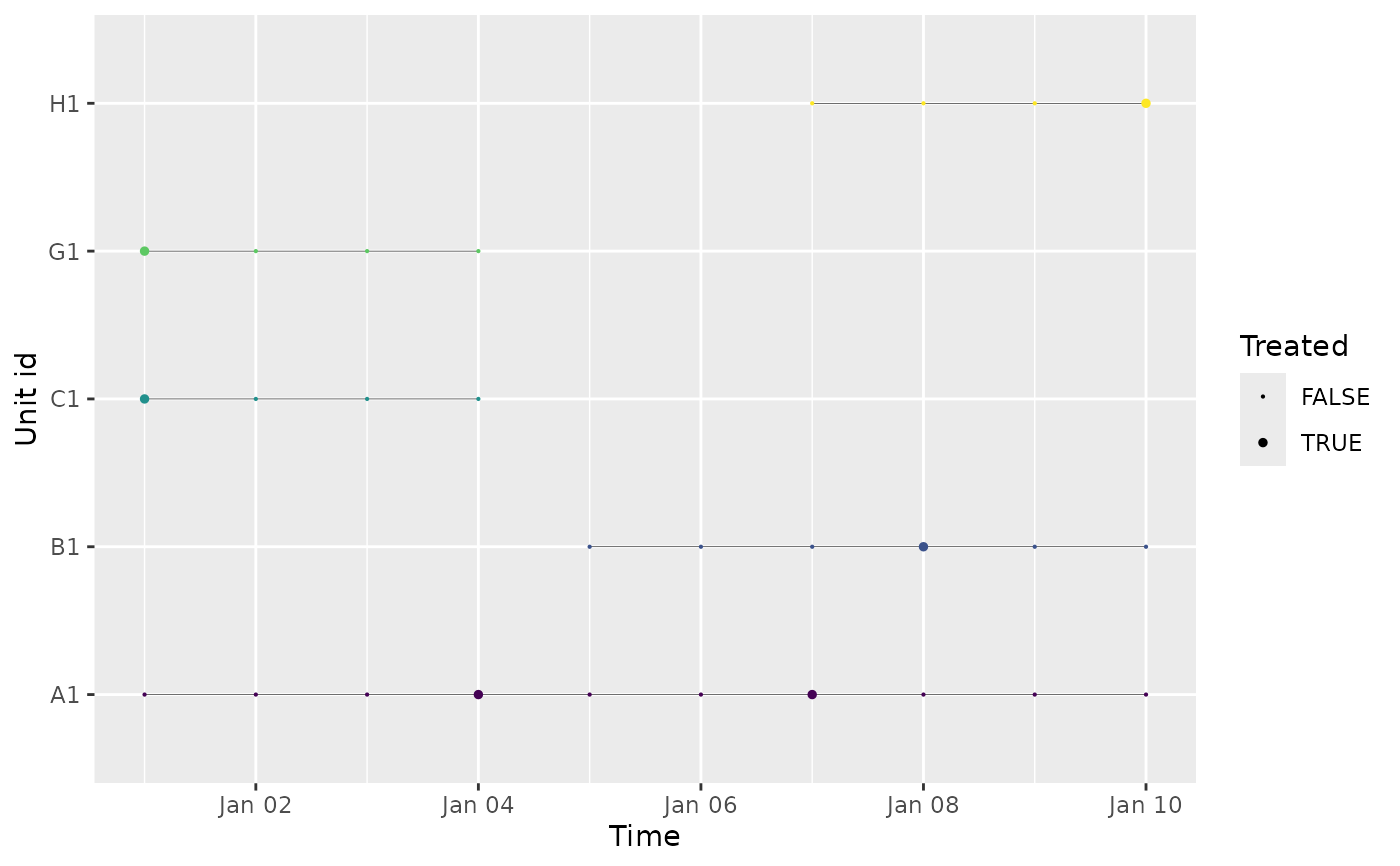
 visualize_panel(event_horizon_panel)
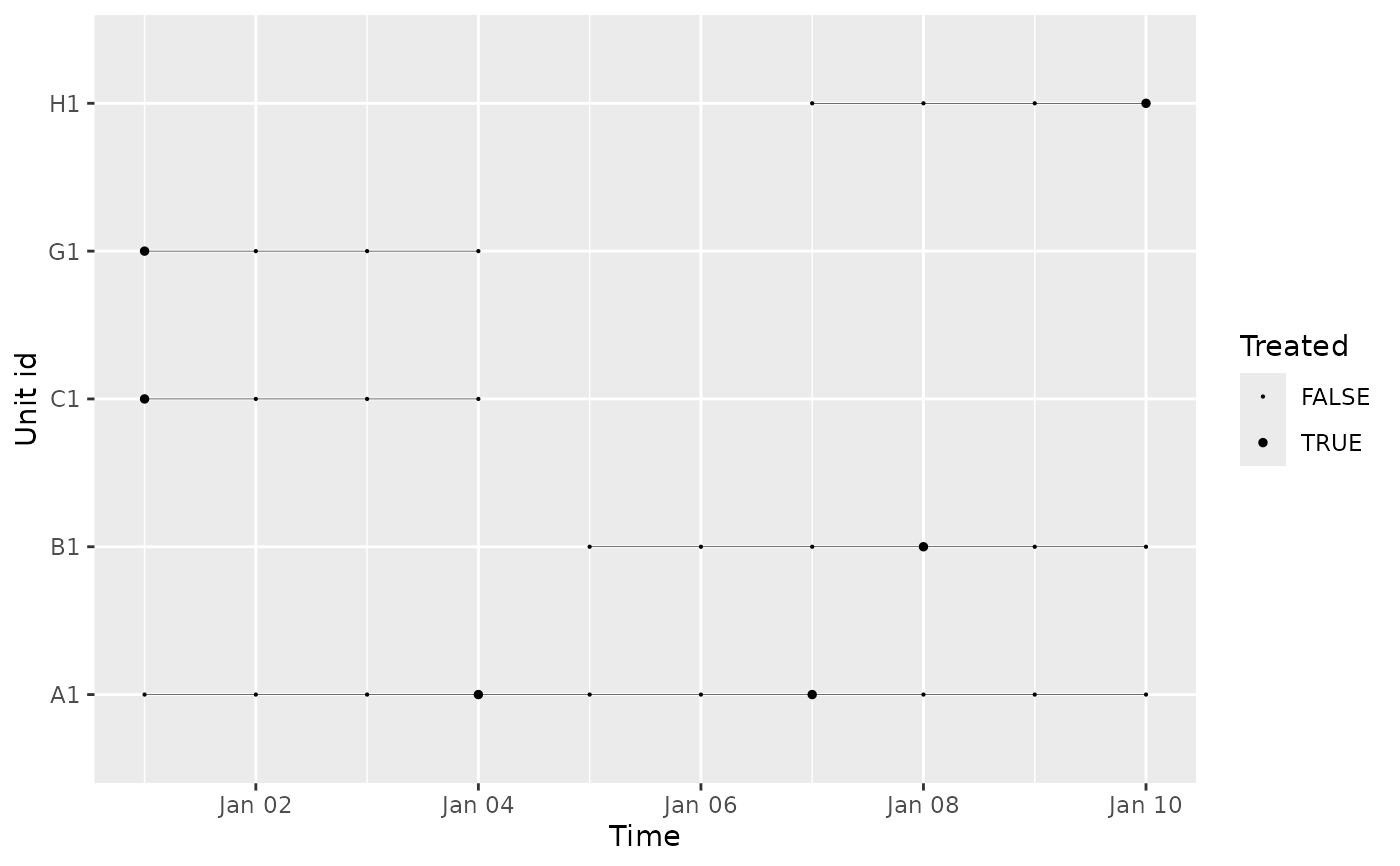 visualize_panel(event_horizon_panel, prepped = TRUE)