Geographic data models

Raster data

Juan Carlos Villaseñor-Derbez (JC)

Intro slide

  • We mentioned that spatial data can be represented in a vector model, or a raster model

  • We focused on vector data, which is represented by points, lines, polygons (and combination of these)

  • In R, we use the simple features standard to work with vector data via the sf package

  • sf objects have three main components:

    • CRS
    • geometry
    • attributes

Raster data model

  • The world with the continuous grid of cells (gridcells, grid cells, grid-cells, or pixels)
  • All pixels are the same size1
  • For 99% of the cases grid cells will be squares

Raster data model example

Code
rsmaes_poly_coords <- st_polygon(
  x = list(
    matrix(
      data = c(
        -80.163017, 25.733950,
        -80.164236, 25.732816,
        -80.163772, 25.732353,
        -80.163924, 25.732148,
        -80.163455, 25.731597,
        -80.162187, 25.731605,
        -80.160968, 25.732172,
        -80.163017, 25.733950),
      ncol = 2,
      byrow = T)),
  dim = "XY") |> 
  st_sfc(crs = 4326)

rsmaes_poly <- st_sf(id = "Rosenstiel (polygon)",
                     geometry = rsmaes_poly_coords)

mapview(rsmaes_poly)
Code
rsmaes_rast <- rasterize(
  x = vect(rsmaes_poly),
  y = rast(resolution = 0.0001,
           crs = "EPSG:4326",
           val = 0,
           xmin = -80.168, xmax = -80.155,
           ymin = 25.730, ymax = 25.735),
  field = 1)

names(rsmaes_rast) <- "Rosenstiel"
rsmaes_rast[is.na(rsmaes_rast)] <- 0

mapview(rsmaes_rast,
        legend = F)

Components of a raster

  • Typically two components:
    • Header (“metadata” with CRS, extent, and origin)
    • Matrix (the actual “data” we want to represent)
  • x-coordinates = columns
  • y-coordinates = rows

GFW 1: Trees

Tree cover in the year 2000, defined as canopy closure for all vegetation taller than 5m in height. Encoded as a percentage per output grid cell, in the range 0–100.

Code
tc <- rast(here("data/Hansen_GFC2015_treecover2000_00N_080W.tif"))

tc
class       : SpatRaster 
dimensions  : 40000, 40000, 1  (nrow, ncol, nlyr)
resolution  : 0.00025, 0.00025  (x, y)
extent      : -80, -70, -10, 0  (xmin, xmax, ymin, ymax)
coord. ref. : lon/lat WGS 84 (EPSG:4326) 
source      : Hansen_GFC2015_treecover2000_00N_080W.tif 
name        : Hansen_GFC2015_treecover2000_00N_080W 

Let’s check the resolution and number of cells

Code
0.00025 * 111.31 * 1000
[1] 27.8275
Code
plot(tc)

Download data from GFW earthengine portal

Why are rasters faster?

  • There is a fundamental relationship between resolution, extent, and origin:

\[ \mathrm{resolution} = \frac{x_{max} - x_{min}}{n_{col}} , \frac{y_{max} - y_{min}}{n_{row}} \]

  • Raster data are typically “lighter” (and faster to work with) because they don’t need to store all the coordinates

  • How many coordinates do you need to store if you know origin, extend, and resolution?

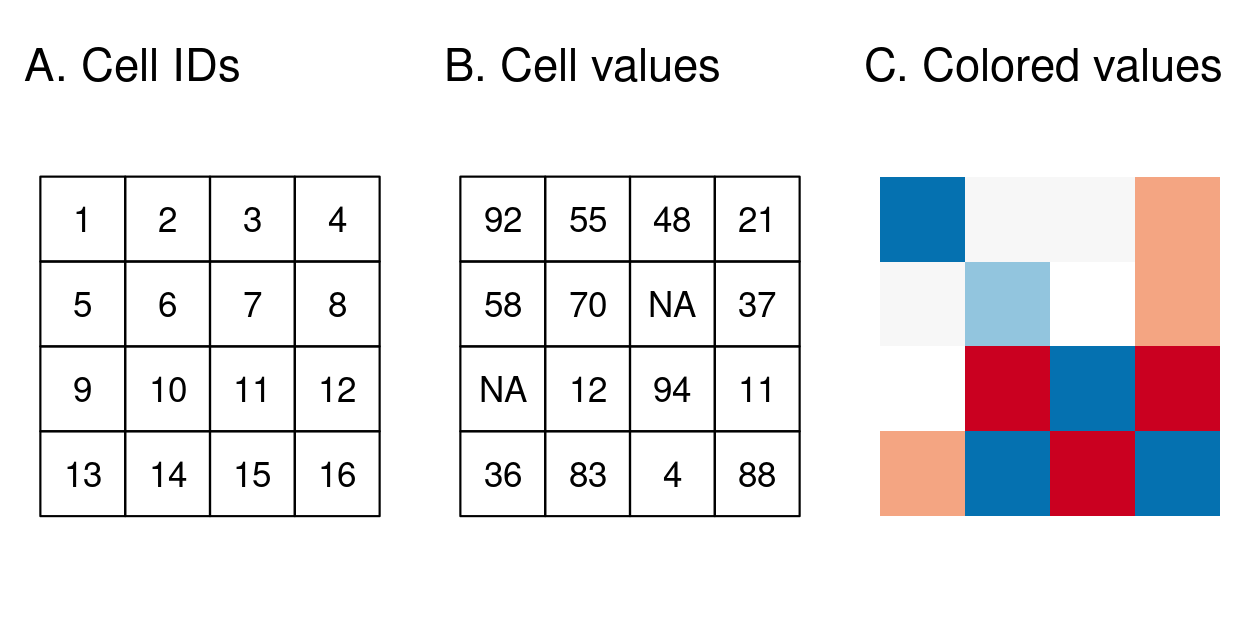
Accessing data in the raster

You can access data by their Cell ID or by their position in the matrix

Modified from GeoCompR

GFW 2: Fishers

Code
fe <- rast(here("data", "gfw_fishing_effort_2024.tif"))

fe
class       : SpatRaster 
dimensions  : 334, 720, 1  (nrow, ncol, nlyr)
resolution  : 0.5, 0.5  (x, y)
extent      : -180, 180, -77.8, 89.2  (xmin, xmax, ymin, ymax)
coord. ref. : lon/lat WGS 84 (EPSG:4326) 
source      : gfw_fishing_effort_2024.tif 
name        :      sum 
min value   :      0.0 
max value   : 778060.7 
Code
plot(log(fe))