Sea Surface Temperature
data_sst.RdMean daily Sea Surface Temperature (°C) derived from 0.5° resolution imagery within bounding box (lon_min = -81, lon_max = -79.75, lat_min = 25.25, lat_max = 25.75).
Format
## `data_sst` A data frame with 2,922 rows and two columns:
- date
Date - Date of the observation, in yyyy-mm-dd format
- temperature_C
Numeric - Mean sea surface temperatrure, measured in °C
Source
Raw data come from NOAA AVHRR Optimum Interpolation v2.1 - SST https://coastwatch.pfeg.noaa.gov/erddap/griddap/ncdcOisst21Agg_LonPM180.html. The script to generate the data is https://github.com/jcvdav/EVR628tools/blob/main/data-raw/data_sst.R
Examples
library(EVR628tools)
library(ggplot2)
# Look at the first 10 rows
head(data_sst, 10)
#> # A tibble: 10 × 2
#> date temperature_C
#> <date> <dbl>
#> 1 2000-01-01 24.9
#> 2 2000-01-02 24.8
#> 3 2000-01-03 25.2
#> 4 2000-01-04 25.4
#> 5 2000-01-05 25.5
#> 6 2000-01-06 25.6
#> 7 2000-01-07 25.6
#> 8 2000-01-08 25.5
#> 9 2000-01-09 25.5
#> 10 2000-01-10 25.7
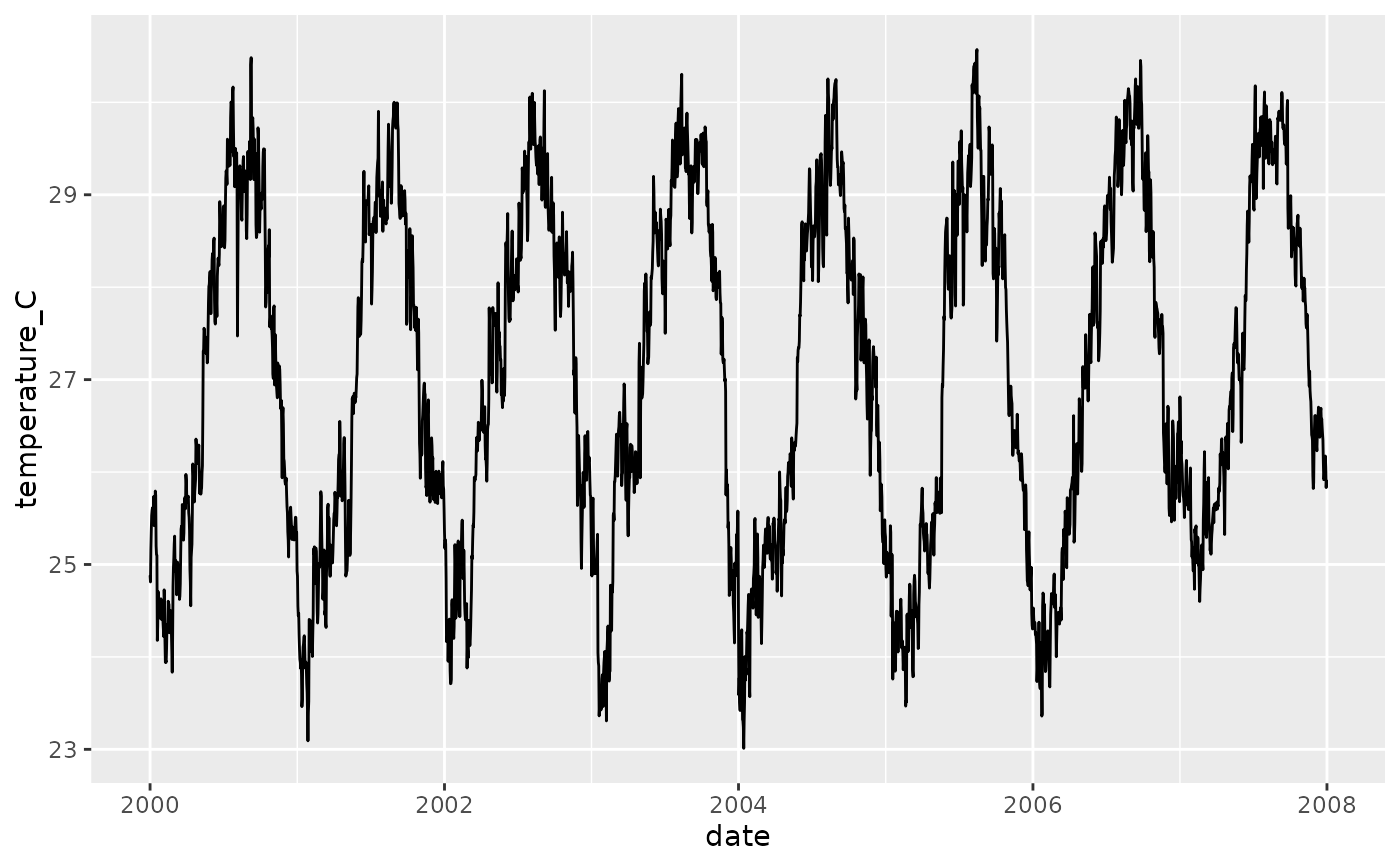
# Make a time series plot
ggplot(data = EVR628tools::data_sst,
mapping = aes(x = date, y = temperature_C)) +
geom_line()